

The REALTORS® Association of Hamilton-Burlington (RAHB) reported 1,035 sales of residential properties located within the RAHB market area were processed through the Multiple Listing Service® (MLS®) System in October, 2018. This is a 13.1 per cent decrease from the same month last year. Year to date, sales are 17.7 per cent lower than last year at this same time.
The sales-to-new-listings ratio, which can point to whether a market is in favour of sellers (above 60 per cent) or buyers (below 40 per cent) was 60.1 per cent. This is higher than last month and on the cusp of returning to a seller’s market. For comparison, in October 2017 the ratio was 65.5 per cent.
“The single family market in the overall RAHB area remains in a balanced position, with a good inventory of homes for those looking for a detached property,” says RAHB CEO George O’Neill.
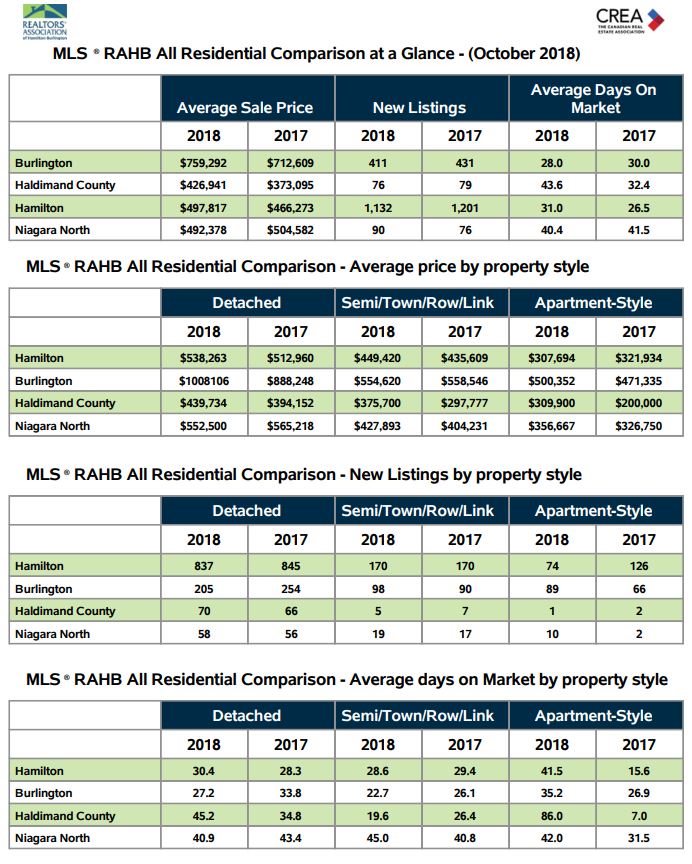
The number of sales for single family properties within the entire RAHB market fell compared to the same month last year, while the average sale price increased by 5.9 per cent. Townhouse sales activity was also down from 2017, while the average townhouse sale price remained virtually the same. Apartment-style property sales were down from last year; however, average sale price was up by 11.6 per cent compared to October of 2017.
When the major areas within RAHB’s market are isolated, Hamilton, Burlington and Haldimand County all saw an increase in overall average sale price, while Niagara North experienced a decrease in overall average price. There was also an increase in average sale price for all property styles in each of the four RAHB market areas, except for Niagara North detached homes, Burlington townhouses and Hamilton apartment-style properties.
“Across the entire RAHB market area, the average price, number of days on market, and other factors differed when looking at housing style,” says O’Neill. “To ensure you have all the information you need to make an informed decision when buying or selling, always consult with a local REALTOR®.”
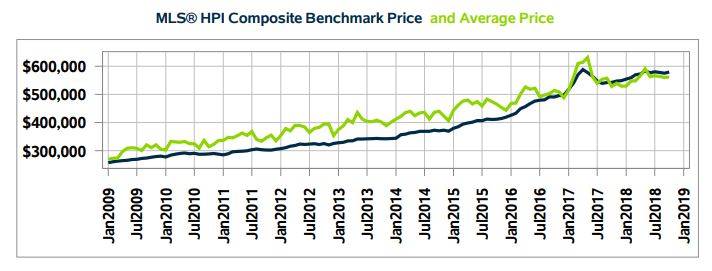
In October of this year, RAHB implemented the Canadian Real Estate Association’s (CREA’s) MLS® Home Price Index (HPI). The MLS® HPI is based on MLS® listing content and takes into account various details of a property, such as number of bedrooms, age of the home, lot size, number of fireplaces, number of bathrooms, type of foundation, and other relevant attributes. All RAHB REALTORS® have detailed access to this comprehensive information and can help ensure buyers and sellers remain informed. An overview of CREA’s HPI can be found at www.crea.ca/housing-market-stats/mls-home-price-index/.
The MLS® HPI Composite Benchmark encompasses a “typical” residential property within a given area. The graph below shows the composite benchmark price compared to the overall average residential price for the entire RAHB market over the past decade.
Specific neighbourhoods within the overall RAHB market area see results that often differ from the average of the entire RAHB market area. Because neighbourhoods vary, determining the right price when buying or selling a property can be challenging. Local RAHB REALTORS® have the experience, knowledge and tools to help buyers and sellers make those big decisions.
*Average sale price is based on the total dollar volume of all properties sold through the RAHB MLS® System. Average sale price can be useful in establishing long-term trends, but should not be used as an indicator that specific properties have increased or decreased in value. Talk to your local REALTOR®.
For more detailed statistics about your area of interest, contact me anytime!


